
As Intel releases its 10th generation Core processors, AMD has responded with a new line of refresh processors, the 3000-XT series. Like the original Ryzen 3000-series of processors, the XT chips are built on the 7nm manufacturing process, optimized and refined to reach higher operating speeds. However, despite being objectively better, AMD has decided to sell the new XT parts alongside the X (and Non-X for the Ryzen 5) variant, at a low price increase.
So for today, what we’ll be checking out is the most affordable variant, the Ryzen 5 3600XT. We put it through several synthetic benchmarks and games in both the stock and overclock to see how well it performs under different workloads.
Specifications, Price, Unboxing
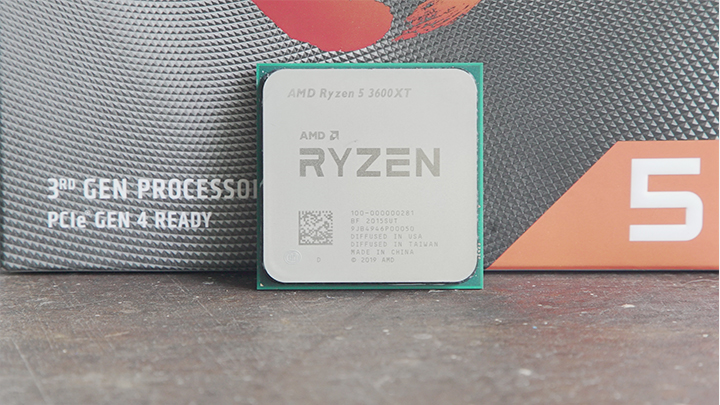
The Ryzen 5 3600XT received a minor 100MHz increase to its boost speed compared to the Ryzen 5 3600X variant. Its TDP, cache, and RAM specifications, however, remain the same. As for pricing, AMD Philippines has set the Suggested Retail Price at PHP 14,839, however, local retailers such as PCHub is pre-selling the processor for PHP 15,620.

While a 100MHz boost may not seem significant, it means that these chips are better binned, able to achieve higher overclocks with the same voltage or the same speed at a lower voltage.

Inside our sample, we received the processor itself, the sticker, and a Wraith Spire cooler.
Test Setup and Overclocking
To test the Ryzen 5 3600XT, we used the following setup:
| Processor | AMD Ryzen 5 3600 XT |
|---|---|
| Motherboard | ASRock X570 Taichi |
| Cooler | NZXT Kraken X62 |
| RAM | 16GB G.Skill Trident Z Royal 3600MHz CL16-16-16-36 |
| Graphics | AMD RX 5700 |
| Power Supply | SilverStone Strider 850W Gold |
| Windows Version | Windows 10 Professional 64 bit Build 09041.329 |
| Graphics Driver Version | Radeon Software 20.4.2 |
| Bios Version | 1.40 |
Author’s Note: We downgraded the BIOS from the latest version 3.20 to 1.40, as we experienced instability with anything but the stock configuration. The problems persisted with the RAM’s XMP profile, Precision Boost Overdrive, and Overclocking.
While we wanted to test with a higher tiered card, our NVIDIA RTX 2080ti is stuck in the studio. Thankfully, AMD has sent us an RX 5700 for our testing.
We also tested the system when overclocked. Our particular sample managed to achieve a stable 4.5GHz at 1.35V, with the Load Line Calibration set to 3. Setting the speed to 4.6GHz required voltages higher than what AMD recommends, and would degrade the chip when running 24/7. Instead, we settled for 4.5GHz to show users how much performance they can realistically get.
Testing Methodology
All testing was performed at a 30° ambient temperature, with the NZXT Kraken X62 set to performance. Our stock results are based on the processor’s out-of-the-box performance, with the RAM’s XMP turned on, Precision Boost Overdrive set to Auto, and Windows Power Plan set to Balanced.
We wanted to test sustained performance during our benchmarking. Hence, we ran synthetic benchmarks thrice in quick succession and recorded the third result.
As for games, we tested at 1080p at the minimum preset to help limit GPU bottlenecking and showcase the processor’s full capabilities when using a better GPU. For games with in-game benchmarks, we ran the benchmark in succession and recorded the result to show sustained performance.
For Battlefield V and Control, we ran the same mission over and over for 10 minutes to help limit variance. Meanwhile, for Valorant, note that opening the scoreboard and the buy menu significantly reduces the frame rate and may skew the result.
CPU Tests: Synthetic Benchmarks
First on our list of synthetic benchmarks is Maxon’s 4D rendering software Cinebench R20. We tested both the single and multi-core performance of the CPU, and we got the following results:

Here we can see overclocking the Ryzen 5 3600XT nets 8.5% performance gains on the multi-core score over the out of the box configuration. The single-core score, however, only improved by 1.16%.
Testing the last generation Cinebench R15 again for both single and multi-core performance, we saw that overclocking net a smaller 7.77% increase in the multi-core score, and a negligible 0.049% in the single-core score.

Next is Corona 1.3, a photorealistic renderer available for Autodesk 3ds Max and MAXON Cinema 4D. It computes for the rays the processor can render per second.

Our last rendering benchmark is V-Ray, a standalone benchmarking tool developed by Chaos Group that tests how fast the processor renders. We ran the CPU test and got the following results:

Next up si Primate Labs’ cross-platform benchmark, GeekBench 5. GeekBench runs the processor through multiple workloads, from emailing, playing music to Machine Learning. It tests for both single and multi-core performance, and we got the following results:

Again, overclocking the system did not do much in this test, as we only got a 3.63% and 1.12% increase in the multi-core and single core score, respectively.
Moving over to UL’s PCMark 10, which covers tasks performed in the workplace, we got a respectable score of 8,152 at stock. Overclocking the system net a 2.04% increase in performance, or an additional 167 points.

Next up is UL’s 3D Mark suite. We ran both FireStrike and TimeSpy to test the processor’s Direct X11 and Direct X12 performance. We noted both the Physics and Overall scores below:

When running the DX11 based FireStrike, overclocking the system net a more significant 5.16% gain when comparing the Physics Scores. The overall score, however, did not change that much as the GPU was holding the processor back.

Running the multi-core friendly DX12 benchmark TimeSpy, however, net the largest gains of 6.94% out of all the synthetic benchmarks tested.
With sufficient cooling, the Ryzen 5 3600XT has proven to be a capable processor, of overclocking the Ryzen 5 3600XT does not net significant gains,
CPU Tests: Gaming Benchmarks
Next up are gaming benchmarks. We ran several AAA Direct X12 games as well as two popular shooters that stress only a few cores. Here are the results:
First up is Electronic Arts’ Battlefield V. Here, the Ryzen 5 3600XT managed to consistently hit the 200FPS frame cap, save for instances when there were a lot of explosions and bullets going on in the screen. Overclocking the system also didn’t help that much, as we only managed to gain an extra 2FPS.

Next up is multiple the Game Award winner Control. While we were GPU bound in this title, the Ryzen 5 3600XT was still capable of delivering an average of 144FPS for those who play on a fast refresh rate monitor. Overclocking the system, however, did not net significant gains as we only received a 3FPS boost compared to its stock performance.

Moving over to GTA V, we got 183.5 FPS in the in-game benchmark at stock and got an extra 2 FPS when overclocked.

The biggest gains we got from overclocking the system is from Shadow of the Tomb Raider, achieving an additional 7 average FPS or around 4.46%. Like our TimeSpy CPU score, as the game uses more cores, having a higher all-core frequency will provide more tangible improvements.

Next up are two popular shooters from Valve and Riot, CS: GO and Valorant. As fast-paced, first-person shooters, higher framerates are welcome, as this affects the perceived smoothness of the game. However, as popular e-sports titles, they’re designed only to use a few cores, so even low-end systems can run the game well. As such, the Ryzen 5 3600XT can boost to higher frequencies even at stock. While we did manage to see a large 14 and 8 FPS gains from overclocking, in reality, they’re just 3.17% and 2.88% improvements, respectively.


Like in our synthetic benchmarks, overclocking the system showed minimal gains, with Shadow of the Tomb Raider showing the highest improvement of 4.46%. That being said, the processor was highly capable, as removing the GPU bottleneck allows users to achieve high framerates.
Power Draw, Efficiency, Price-to-Performance
We measured the power draw using a digital wattmeter while the system was both idle and under full load. Do note that this takes into consideration the total power draw and not just the CPU power draw. The GPU was consistently operating below 3% during testing, and should not contribute to the results significantly. We ran Cinebench R20 to test the system draw at full load, and recorded the following results:

Overclocking the system increased the total power drawn by 21 Watts (9.68%) when under full load, and 4 Watts (3.63%) while idle.
Computing for the Ryzen 5 3600XT’s efficiency under rendering workloads, we divided the multi-core score from Cinebench R20 by the total power draw.

When it comes to performance per watt, the Ryzen 5 3600XT was able to deliver 17.4 points of performance per watt.
Measuring the price to performance, we divided the Ryzen 5 3600XT’s PHP 14,839 SRP by the average FPS of the six games tested.

Of the six games tested, the price per frame comes out at PHP 63.53 at stock, or PHP 63.06 when overclocked.
AMD StoreMi 2.0
In addition to the performance gained over X and non-X models, the XT series is also the first batch of processors that are compatible with AMD’s Intel Optane competitor, the StoreMi 2.0.

AMD’s StoreMi combines the speed of SSDs with the capacity of HDDs by using the SSD as cache for the HDD. AMD claims this speeds up boot times by up to 31% and decreases game load times by up to 13% when compared to using an HDD only. Unfortunately, we couldn’t get the new StoreMi 2.0 running on our system, as it crashes upon installation. This may be due to the rolled back motherboard BIOS version we installed.
We feel this is a better alternative to Optane, as users are free when it comes to SSD and HDD compatibility. However, at the time of writing, it’s only available for XT-series processors paired with X570 motherboards, with support for B550, 400-series, X399, and TRX40 chipsets coming by Q3 2020.
Conclusion
The Ryzen 5 3600XT offers users an amazing gaming performance, while still being capable of handling productivity workloads. With its release, it’s difficult to recommend the Ryzen 5 3600X over its XT counterpart as AMD has priced them similarly. At PCHub, for example, the XT variant costs only PHP 600 more – which would be negligible considering the total system cost of building a new PC.
Stay tuned for our Ryzen 7 3800XT review, as we investigate whether gamers need the additional two cores, or if they should instead put the extra budget into a better GPU.
AMD Ryzen 5 3600XT specs:
Cores/Threads: 6/12
Base/Boost Clock: 3.8GHz/4.5GHz
Total L2 Cache: 3MB
Total L3 Cache: 32MB
TDP: 92W
Unlocked
CMOS: TSMC 7nm FinFET
Socket: AM4
PCIe Version: PCIe 4.0


0 Comments
Leave a Reply