
We’ve recently reviewed the new XT models from AMD, namely the Ryzen 5 3600XT and Ryzen 7 3800XT. Today, we’ll be taking a look at AMD’s most powerful XT processor, the Ryzen 9 3900XT. We’ll be running it through our usual benchmarks to see how well it performs in various productivity tools, how well additional cores scale under different workload, and of course, its gaming performance. Is the Ryzen 9 3900XT worth the PHP 29,470 investment, or should you get the more affordable variants instead? Read on to find out.
Specifications, Price, Unboxing
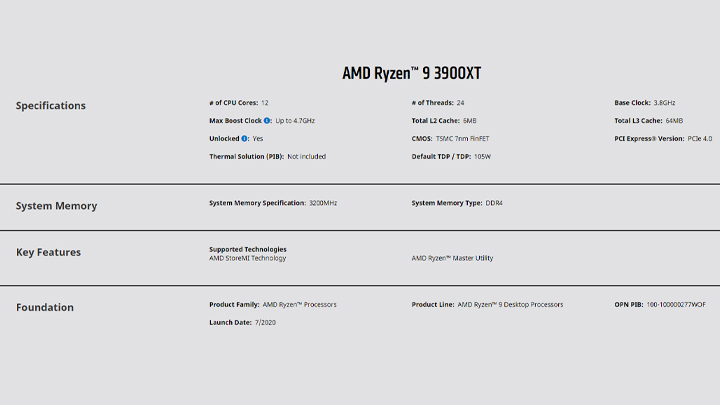
Like the rest of the Ryzen XT lineup, the Ryzen 9 3900XT has the same 3.8GHz base frequency, 64MB L3 cache, and 105W TDP as the non-XT variant. The only difference between it and its X counterpart is the boost frequency, which has been increased by 100MHz from 4.6GHz to 4.7 GHz.
Interestingly, the Ryzen 9 3900XT appears to be priced appropriately – almost twice as much as the six-core Ryzen 5 3600XT. Like the Ryzen 7 3800XT, it does not come with an included cooler. Instead, AMD recommends users to use an AIO. Keep this in mind when preparing a budget for your system.

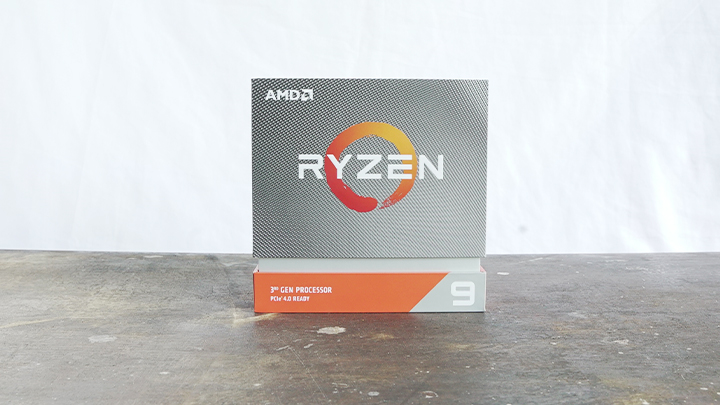
In our sample unit, the box is bare, save for the processor, and included Ryzen 9 sticker.
Test Setup
To test the 12-core Ryzen 3900XT, we used the following setup:
| Test System | |
|---|---|
| Processor | Ryzen 9 3900XT |
| CPU Cooler | NZXT Kraken X62 |
| RAM | 16GB G.Skill Trident Z Royal 3600MHz CL16-16-16-36 |
| Graphics Card | AMD RX 5700 |
| Power Supply | SilverStone Strider 850W Gold |
| Windows Version | Windows 10 Professional 64 bit Build 09041.388 |
| Graphics Driver Version | Radeon Software 20.5.1 |
| Bios Version | 1.40 |
Unfortunately, we were noticing instability issues with the XMP profile of the G. Skill Trident Z Royal sticks we used for testing. While we could run lightly threaded tasks, the system crashes when taking advantage of all 12 cores. We tested with PBO on and off as well as various RAM timings and frequencies to no avail. Hence, all our benchmarks were run at the stock 2133MHz frequency. Due to this, our benchmark results may be lower than what the processor is fully capable of. Due to the instability issues, we also did not push for an overclock on the Ryzen 9 3900XT.
Author’s note: Other reviewers and users from forums were able to run DDR4 RAM at 3600MHz with no issues. This may be due to the older BIOS version we were using, and new updates may resolve the issue. Nonetheless, be aware when building your PC that this issue may persist.
Testing Methodology
All testing was performed at a 30° ambient temperature, with the NZXT Kraken X62 set to performance mode. Our stock results are based on the processor’s out-of-the-box performance, with the RAM’s XMP turned off, Precision Boost Overdrive set to Auto, and Windows Power Plan set to Balanced.
We wanted to test sustained performance during our benchmarking. Hence, we ran synthetic benchmarks thrice in quick succession and recorded the third result.
As for games, we tested at 1080p at the minimum preset to help limit GPU bottlenecking and showcase the processor’s full capabilities when using a better GPU. For games with in-game benchmarks, we ran the benchmark in succession and recorded the result to show sustained performance.
For Battlefield V and Control, we ran the same mission over and over for 10 minutes to help limit variance. Meanwhile, for Valorant, note that opening the scoreboard and the buy menu significantly reduces the frame rate and may skew the result.
CPU Tests: Synthetic Benchmarks
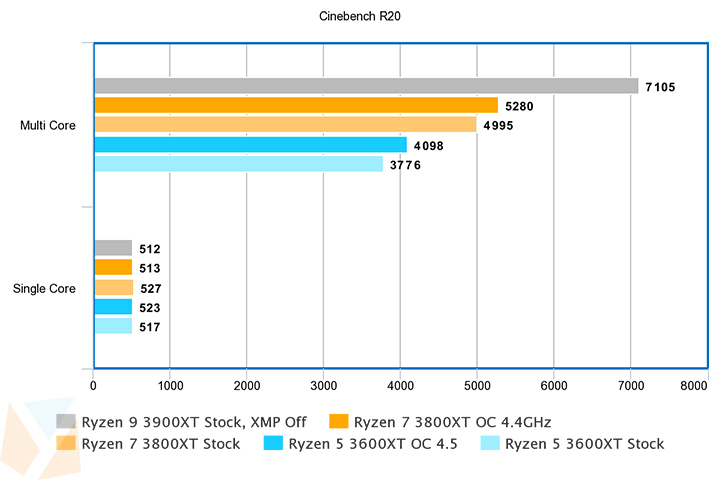
First on our list of synthetic benchmarks is Maxon’s 4D rendering software Cinebench R20. AMD’s Ryzen architecture retains its efficiency with additional cores, as the 12-core Ryzen 9 3900XT is 88% more powerful compared to the 6-core Ryzen 5 3600XT and 34.56% more powerful compared to the 8-core Ryzen 7 3800XT. Surprisingly, using lower frequency RAM had a much smaller effect on performance on Cinebench than we expected.
The performance gained with the additional cores continues with Cinebench R15 as well, scoring 87.6% better than the Ryzen 5 3600XT and 42.71% better than the Ryzen 7 3800XT.

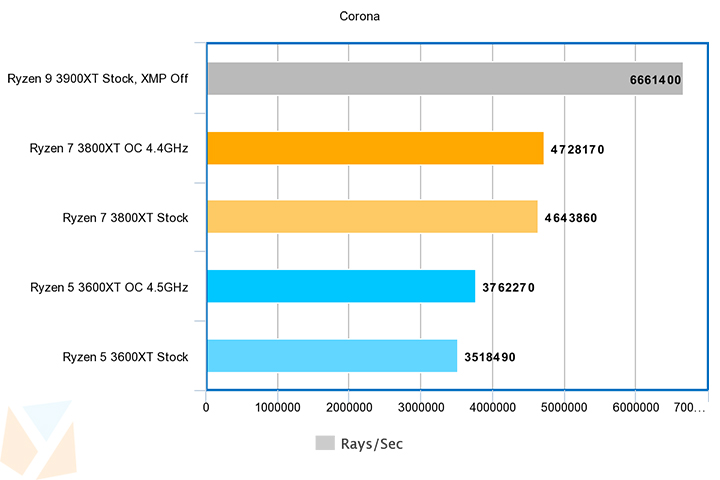
Next is Corona 1.3, a photorealistic renderer available for Autodesk 3ds Max and MAXON Cinema 4D. It computes for the rays the processor can render per second. The performance increase continues with the Corona benchmark, with the Ryzen 9 3900XT scoring 43.44% and 89.33% better compared to its 6 and 8 core counterparts.
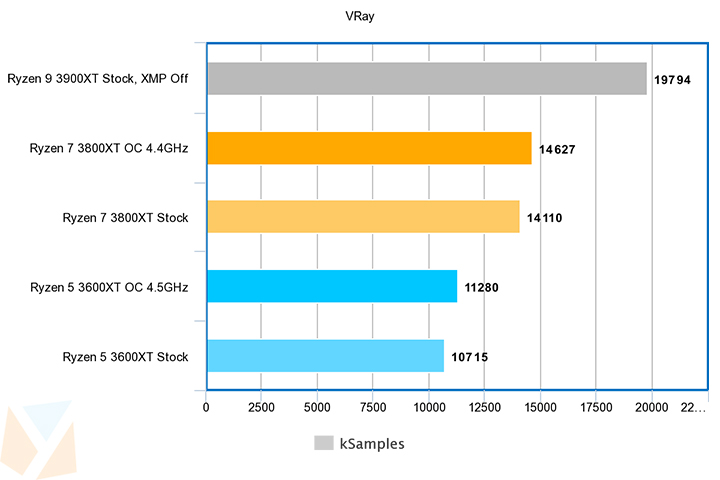
Our last rendering benchmark is V-Ray, a standalone benchmarking tool developed by Chaos Group that tests how fast the processor renders. Purchasing the highest Ryzen 9 3900XT nets a 40.28% performance improvement over the stock Ryzen 7 3800XT and an 84.73% performance gain over the stock Ryzen 5 3600XT.
Next, we ran Primate Labs’ cross-platform benchmark, GeekBench 5, which runs the processor through multiple workloads, from emailing, playing music to Machine Learning. In this test, the Ryzen 9 3900XT did not double the Ryzen 5 3600XT’s result. However, it still scaled well as it scored 24.26% and 48.1% better compared to the Ryzen 7 3800XT and Ryzen 5 3600XT.

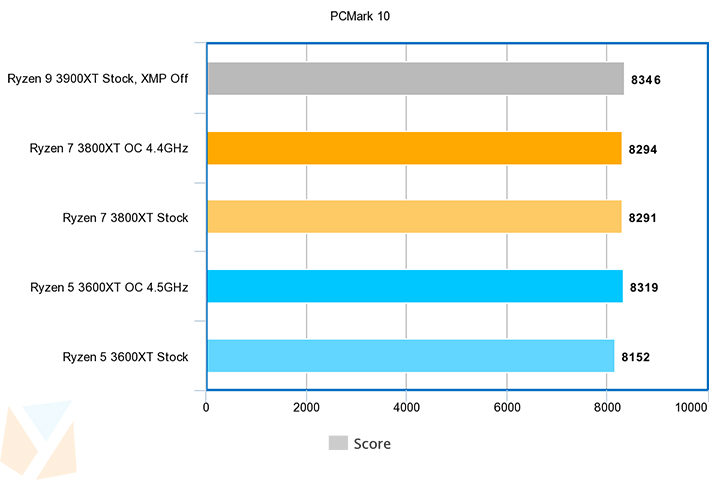
Moving over to UL’s PCMark 10, which covers tasks performed in the workplace, the Ryzen 9 3900XT did not offer any significant improvements over the other XT variants. Hence, when only using office applications such as Microsoft Office, video conferencing, emailing, and browsing the web, users are better off with the more affordable Ryzen 5 3600XT.
Our last synthetic benchmarks are 3DMark’s DX11 and DX12 tests Fire Strike and Time Spy. As expected, the Physics score in Fire Strike was significantly higher thanks to the additional cores. However, we got a much lower result in the DX12 test Time Spy.
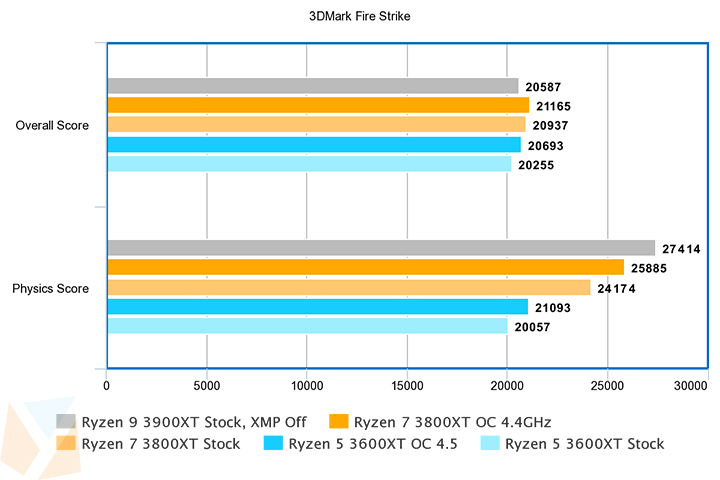
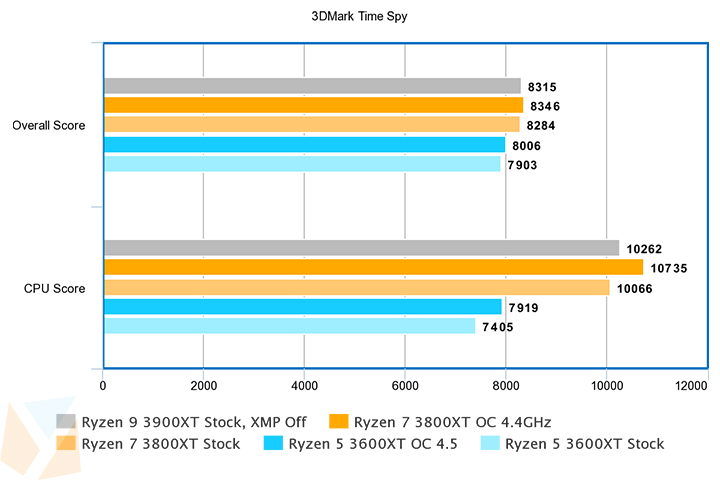
When all cores are stressed, the Ryzen 9 3900XT offers better performance over its 8 and 6 core counterparts. However, when using programs that leverage only a few powerful cores, the more expensive Ryzen 9 processor does not provide a meaningful improvement over the cheaper XT processors.
CPU Tests: Gaming Benchmarks
Next up are gaming benchmarks. We ran several AAA games as well as two popular shooters that stress only a few cores. Here are the results:
First up is Electronic Arts’ Battlefield V. Here, the Ryzen 9 3900XT gain any significant gains over the Ryzen 7 and Ryzen 5 chips, at most only getting an additional 5FPS.

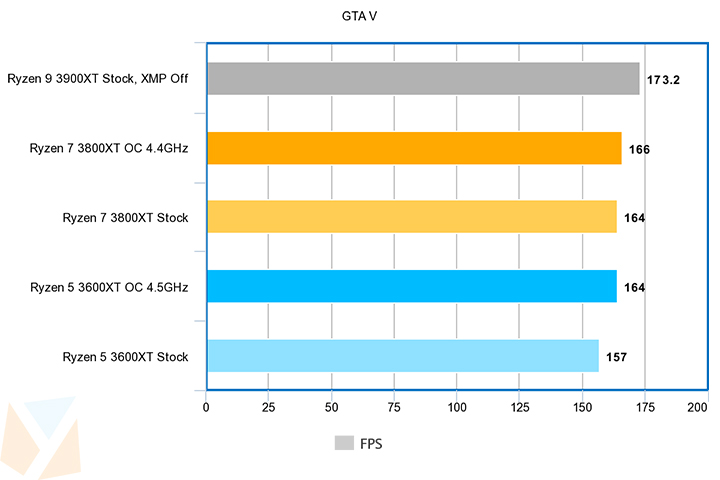
Moving over to Rockstar Games’ GTA V, the Ryzen 9 saw the most significant improvement in performance, averaging 16.2 FPS (10.32%) more FPScompared to the stock Ryzen 5 3600XT, and 8.2 FPS (5.61%) over the Ryzen 7 3800XT.
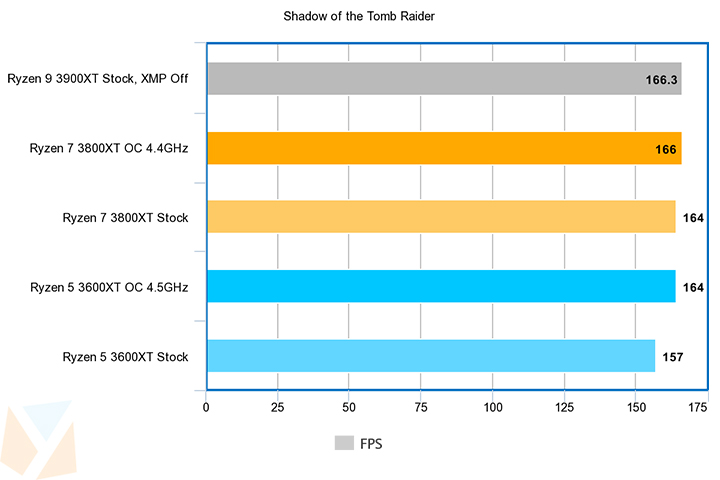
In Shadow of the Tomb Raider, the stock Ryzen 9 3900XT did not fare better than the other XT processors, only able to match the overclocked Ryzen 7 3800XT when running the in-game benchmark.
Moving over to the two shooters, we can see the biggest detriment of the lower RAM speeds, especially when looking at our Valorant results, which averaged 42.2 FPS (14.98%) and 38.4 (13.82%) less FPS compared to the Ryzen 7 and Ryzen 5 chips, respectively.
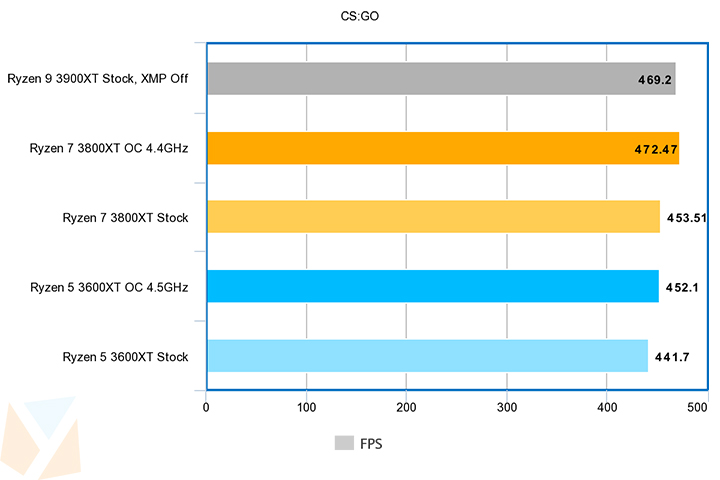
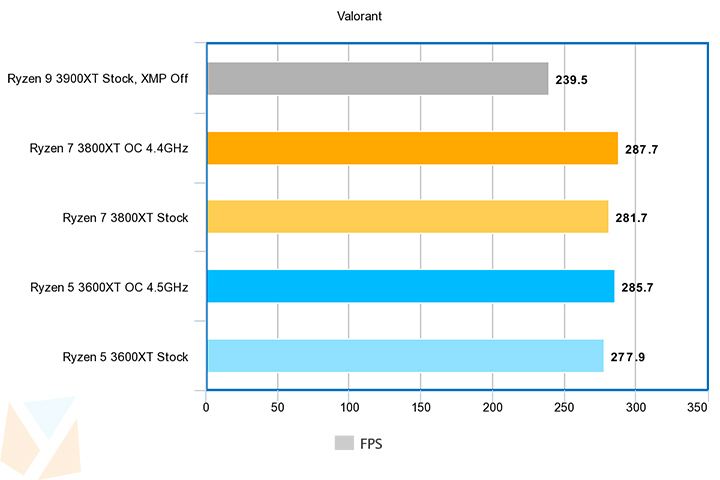
Despite the drawbacks with lower RAM speed, the Ryzen 9 3900XT still manages to edge out or match the lower-tier chips in most titles, except for the popular shooters than benefit from single-core performance the most.
Power Draw, Efficiency, Price-to-Performance
We measured the power draw using a digital wattmeter while the system was both idle and under full load. Do note that this takes into consideration the total power draw and not just the CPU power draw. The GPU was consistently operating below 3% during testing, and should not contribute to the results significantly. We ran Cinebench R20 to test the system draw at full load, and recorded the following results:
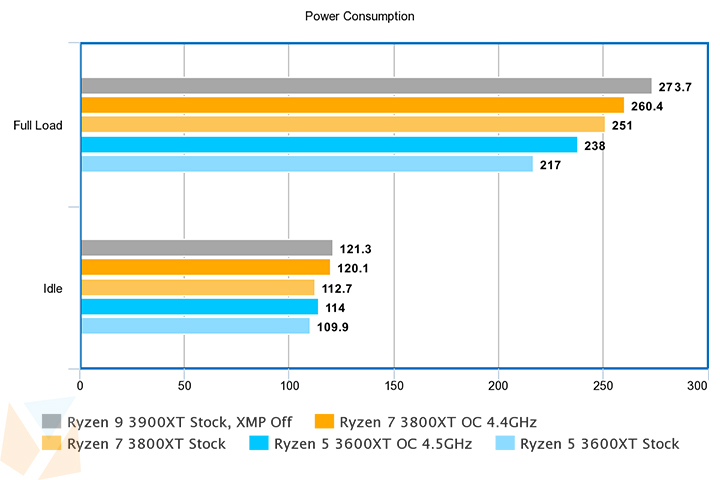
Having more cores significantly increased the power consumption when under full load – using 56.7 more Watts compared to the Ryzen 5 3600XT, and 22.7 more Watts compared to the Ryzen 7 3800XT.
Computing for the Ryzen 7 3800XT’s efficiency under rendering workloads, we divided the multi-core score from Cinebench R20 by the total power draw.
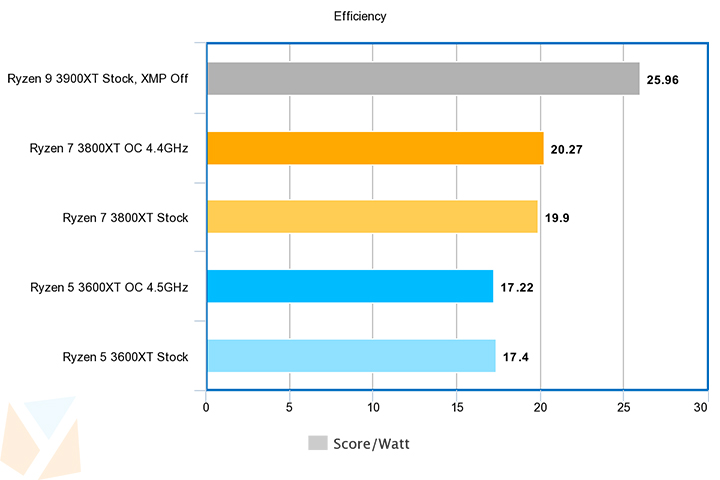
Even with the large jump in power consumption, the Ryzen 9 3900XT is still more power-efficient compared to the other processors, getting almost 26 points in Cinebench R20 per watt consumed.
Measuring the price to performance, we divided the Ryzen 9 3900XT’s PHP 29,470 SRP with the average FPS of the six games tested.
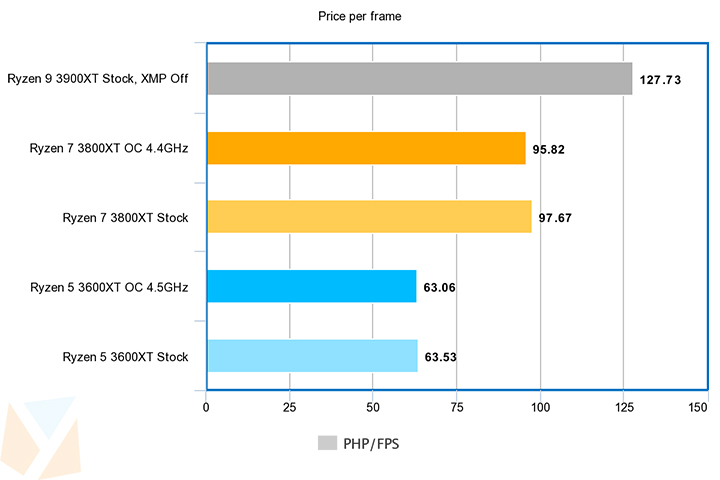
Like the Ryzen 7 3800XT result, the cost per frame increases as the increase in performance did not scale well with games. Purchasing the cheaper Ryzen 5 3600XT can achieve almost the same framerate (especially when overclocked) while costing less than half the price.
Conclusion
The Ryzen 9 3900XT is not a processor that most users need, as the performance in a typical office workload is virtually the same compared to the more affordable models. It’s also not advisable when building a gaming PC, as the additional costs can be allocated on a better GPU, monitor, or peripherals that will have a more tangible effect on your gaming experience. That being said, when all cores are stressed, we see an almost direct correlation between the number of additional cores and performance gained. In our rendering tests, the 12-core Ryzen 9 3900XT was able to almost double the score of the 6-core Ryzen 5 3600XT.

If you stress the CPU in your workload with rendering software, 3D modeling, and the like, then the Ryzen 9 3900XT may be a worthwhile investment. This is especially true considering users will be purchasing this specific processor as a tool of their trade, rather than something built purely for entertainment. Otherwise, content creators, gamers, and enthusiasts may want to purchase the Ryzen 7 3800XT instead. Lastly, if you’re looking to build a gaming and productivity machine, using light-threaded productivity tools like the Microsoft Office Suite can purchase the most affordable Ryzen 5 3600XT without losing too much tangible performance. It’s also a great recommendation for those starting to experiment with heavier tasks, such as content creation.
AMD Ryzen 9 3900XT specs:
Cores/Threads: 12/24
Base/Boost Clock: 3.8GHz/4.7GHz
Total L2 Cache: 6MB
Total L3 Cache: 64MB
TDP: 105W
Unlocked
CMOS: TSMC 7nm FinFET
Socket: AM4
PCIe Version: PCIe 4.0


0 Comments
Leave a Reply