
Editor’s Note: This is part 2 of a three-part series on the brief history of automated elections in the Philippines. Read Part 1 here.
Election conspiracy and democratic deceit? 7-hour glitch, 60-30-10 voting, and other theories in the Philippines
In any election, there will be winners and losers. “Filipinos are not very good losers. They never concede,” said Former President Ferdinand Marcos, Sr. in an interview leading to the 1986 election. Decades later, can we say that perception is not entirely correct? Whether or not it is a behavioral pattern, thoughts regarding election fraud, rigging, manipulation, and violation of the ballot secrecy, among others, remain in the psyche of Filipinos. This despite the history in automating their elections, a development expected to increase electoral accountability, integrity, and transparency. For instance, Pulse Asia reports that 7 percent of Filipinos in 2019 still believe there is cheating in elections, compared to 10 percent in 2016 and 13 percent in 2013. In an electorate of over 67 million voters as of 2022, that would still translate to some 4 million Filipinos who might distrust the outcome of elections.

Of course, the Philippines is not alone when it comes to coming up with conspiracy theories in democratic elections, albeit the voter turnout in the Philippines, averaging 76 percent from 2010 to 2019, can still be regarded as relatively high. Nonetheless, it seems we have no shortage of such rhetoric at home. This article aims to explore some of the more significant conspiracies that may have challenged the trust and confidence of Filipinos for their democracy.
‘7-hour glitch’: a game where you see only the final score?
Prior to 2010, votes in the Philippines were cast manually with preferences being written by hand, while canvassing was automated through tabulating the data with computers. Since automated elections began in 2010, the process goes like this: the voter marks their preferences in ballots, puts the marked ballots in the PCOS machine, and at the end of the day, the votes are counted electronically. Besides the central server of the Commission on Elections (COMELEC), a transparency server operated by election watchdogs operate as soon as the returns are transmitted.

Sounds simple enough, right? It has improved the speed of counting as well. In 2007, the NAMFREL quick count reached 87 percent of precincts by June 2, nearly three weeks after Election Day. In 2019, the PPCRV quick count reached the same level in seven hours. This particular election cycle, however, earned criticism especially from opposition circles as the so-called “7-hour glitch.” For seven hours since the polls closed, the percentage of precincts transmitting data stopped at 0.38 percent according to the unofficial count, and then leaped to 87 percent. The COMELEC explanation focused on issues with the transparency server, as it maintained that their central server was then operating precisely as it should. To recall, the transparency server receives a copy of the election results to provide its own unofficial count. When this server was supposedly “overwhelmed” with data coming from various voting precincts across the nation, the parallel quick count stopped, but the central server kept receiving returns.
As improvement coming from this experience, COMELEC cited using better file transfer management and refactored code to perform at a higher level for the next election. For those less convinced on the automated election system, however, they have been proposing a hybrid system reintroducing manual casting of ballots. Among the proponents of this would turn out to be NAMFREL itself, the pioneer of the quick count mechanism in the country. The current system was likened to a game, except that you cannot watch the game itself. You only see the final score. A tradeoff, obviously, would also be the return to longer time in counting the votes, but if that would be the cost of restoring trust in the democratic process, proponents of the hybrid system believe it is an acceptable exchange. This would bring us to the next point of contention when it comes to the debate regarding the automated election system.
60-30-10 pattern: evidence of cheating or law of large numbers?
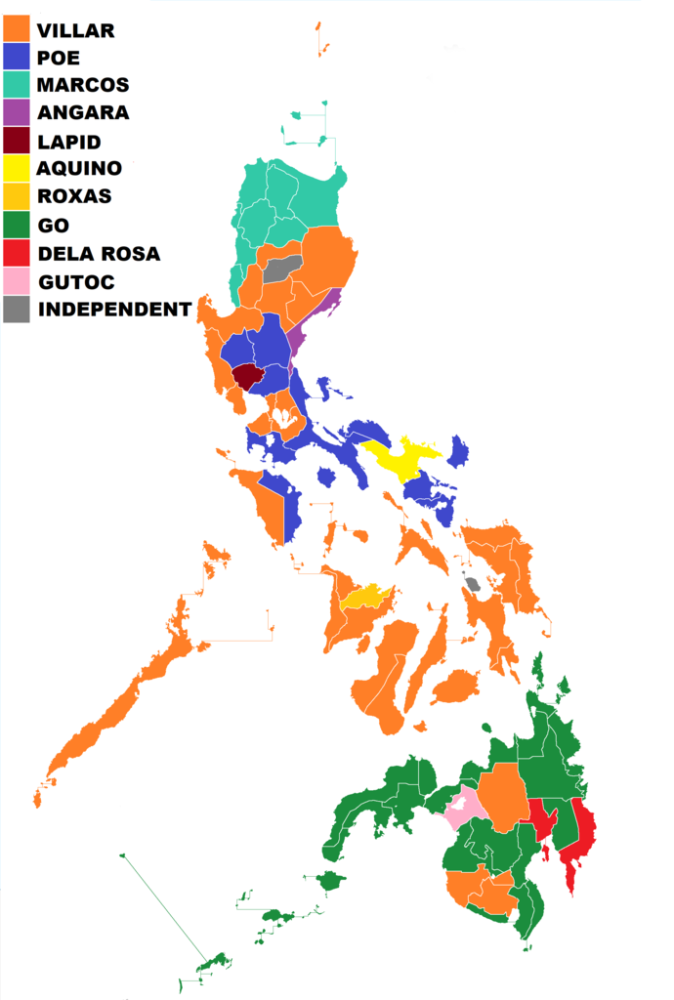
In 2013, a voting pattern dubbed as “60-30-10” went rounds in the web and caused concern for some about the credibility of automated elections. At this point, the system would have run for its second election cycle. The said theory assumed that 60 percent of the votes were allocated to candidates of the administration-led coalition (Team PNoy), 30 percent to candidates of the oppositionist coalition (United Nationalist Alliance), and 10 percent to independent or unaligned candidates. As a result, nine of the 12 administration candidates won seats in the Senate.

The pattern did not necessarily mean the individual vote shares of the candidates. For instance, the average vote share of all Team PNoy candidates were at 36.8 percent. Rather, the analysis was made on the total votes garnered by all candidates. The administration coalition got 59.6 percent of all votes cast for any of its candidates, while the opposition coalition and the independents obtained 30.8 percent and 9.6 percent respectively. The COMELEC denied that it was an unusual trend, while some experts cited the law of large numbers as a possible rationalization.
The law assumes that the average (sample mean) of the results taken from a large number of trials are likely to be closer to the expected value (theoretical mean) than a smaller number, reflecting better the true preferences of the entire population. The trials are supposedly done independently, so while the variance in the micro level appears to be quite random, a pattern is likely to emerge at the macro level when zoomed out to spot the forest from the trees. Breaking down the election results in the local level would show difference on how senatoriables performed.
For example, topnotcher Grace Poe Llamanzares in 2013 did not consistently place first in all regions and provinces. In addition, some of the winning candidates did not enter the top 12 in a number of areas. This suggests that vital details for statistical analysis of electoral performance and strategy may have been lost through averaging.
How does this compare with other Senate elections in recent history? In 2016, the administration-led coalition (Daang Matuwid) had 43.8 percent of all votes cast for any of its candidates, where seven of them won seats. Meanwhile, the administration-led coalition (Hugpong ng Pagbabago) in 2019 got 56.2 percent. Nine of its candidates won seats in the Upper House. On average, that would mean around 53.2 percent of all votes cast for any senatorial candidate have been garnered by administration-led coalitions, with eight of them winning seats. In retrospect, this will be nearly seven points below the alleged 60 percent share allocated for the ruling coalition.
Before automation in 2010, there had been seven senatorial elections since the Senate was restored in 1987. The average vote share of the winning coalition, whether led by administration or opposition, averaged at 53.9 percent. With the exception of 1987, when 24 senators were elected, the average number of senators elected from the winning coalition averaged at eight. This is pretty much a similar level compared to the senatorial election results during the automated election era. Considering this, is technological progress the issue, or perhaps how Filipinos actually vote?
40: the president’s magic number?
The Philippines only had two presidential elections thus far using the automated system, with Benigno “Noynoy” Aquino III and Rodrigo “Rody” Duterte emerging as the victors, respectively. The average vote share of the winning presidential candidates? 40.5 percent. The vice president is not far behind either. The average vote share of winning vice presidents was at 38.4 percent. While this appears to be less complex than the 60-30-10 voting pattern, it has similar concerns. For instance, Ferdinand “Bongbong” Marcos, Jr. pursued an electoral protest which lasted for years after the 2016 polls. Nonetheless, the solution to this paradox may also be found deep in electoral history.
Similar to the argument against the alleged 60-30-10 voting pattern, varying bailiwicks can be noted. For president region-wise, Aquino received in 2010 the highest vote share from Western Visayas with 54.9 percent, while Duterte saw Davao Region give him 89.5 percent of their vote in 2016. Despite this variance, both of them somehow settled for the 40 percent level nationwide. Shall the law of large numbers be cited for this particular case as well?
When the Philippines broke away from the two-party tradition in 1957, wherein seven candidates competed for the presidency, the nation saw their first head of state to be elected by a plurality. Carlos P. Garcia, the Nacionalista Party candidate, won with 41.3 percent of the vote. Still, it was considered an exception rather than the norm at the time. Ever since 1992, meanwhile, the Philippines always had five or more candidates competing for the presidency.
The average vote share of winning presidential candidates from 1992 to 2004? It would be 34.5 percent, six points below the average during the automated election era. One has to note, however, that the 1992 election was a historic low which saw the winning presidentiable (Fidel V. Ramos) garnering less than 24 percent of the vote. Taking it out from the equation would result to a higher average of 39.9 percent for the winning presidentiable. Again, is automation to blame for this election trend, or is it reflective of the electorate’s will?
Conclusion
While no system is perfect, as humanity itself has limitations, arresting technological advancement for elections may be seen as a step backward in the development of high tech democracy. According to the Institute for Democracy and Electoral Assistance (IDEA), 49 of 178 countries surveyed have adopted a form of electronic voting in either national or subnational elections, including the Philippines. While 9 countries have abandoned electronic voting, 25 countries have been conducting studies on its applications in their respective settings. This is significant because the Democracy Index lists only 74 nations with democratic setups out of the 167 countries it measured. The implication would likely be that a majority of the world’s democracies have integrated electronic voting in their elections.
COMELEC’s initiatives towards internet voting, seen to be implemented as soon as the 2025 election, is perhaps one indicator that automated systems might not be going away in the Philippines anytime soon. The strength of those who seek the return to manual ballots, however, have apparently reached the echelons of power. Note how the consolidated Senate bill on the Hybrid Election Act (SB No. 1950) was filed and is pending second reading as of publication time. At this juncture, how do you think will the future of Filipino elections be molded in the digital age?


0 Comments
Leave a Reply