
In every election, there is a winner and a loser. Yet in the Philippines, one of Asia’s longest standing democracies, the dynamic seems to be more about the “cheater” and the “cheated.” In addition to this, the transmission rate, aided by the electoral provider’s 4G network, appears to be the fastest yet in Filipino electoral history. This, however, is a speed that may well baffle an electorate so used to waiting for days before the election returns are processed.
68-32 Magic or Law of Large Numbers?
Back in 2016, the partial and unofficial count stood at 96 percent as of May 18, more than a week after the ballots were cast. This year, 2022, the transparency server by the Commission on Elections (COMELEC) has reached 98 percent within 24 hours. People have since swirled theories online of alleged “pre-programmed” results.
On allegations of electoral fraud, COMELEC Commissioner Marlon Casquejo says that is improbable, “Mahirap i-prove ‘yan kapag sinabi mong there is cheating in terms of the president’s percentage. Meron tayong local source code review. How can you insert such percentage na ipanalo mo ang kandidato mo o matalo ang kandidato mo?”

68-32 for president, 77-23 for vice president: How statistics can disprove the conspiracy theory
Since polls closed last May 9, some of the keener netizens spotted what seemed to be a pattern between the first and second placers in the presidential and vice presidential elections. That is, a ratio of 68-32 (2.125) between the numbers of presumptive president Ferdinand “Bongbong” Marcos, Jr. and nearest rival Maria Leonor “Leni” Robredo, and a ratio of 77-23 (3.348) between the numbers of presumptive vice president “Inday” Sara Duterte Carpio and nearest rival Francis “Kiko” Pangilinan. Looking deeper into the data, how credible is the theory assuming that the total numbers support the notion of an alleged “pre-programmed” election?

For the presidential race, the average ratio across 17 selected transmission periods between 7:17 PM of May 9 and 2:17 PM of May 10 stand at 2.116, which is quite near to the supposed 68-32 pattern giving Robredo a “consistent” 47 percent rate of Marcos votes, but that is where the similarities end. Sixteen of the 17 transmission periods exhibit above average ratios for Robredo, ranging between 2.094 (47.76 percent) and 2.114 (47.30 percent), while the outlier first transmission period shows a ratio of 2.339 (42.75 percent).
Furthermore, isolating the pattern between Marcos and Robredo disregards at least two important factors in analysis. First, there are other candidates. Second, there are geographical and demographic variables affecting the entire equation. Take for example the ratio between Marcos and third placer Emmanuel “Manny” Pacquiao, which showed greater variation than the earlier Marcos-Robredo dynamic. The average ratio between Marcos and Pacquiao? 10.217, which means Pacquiao, according to the 68-32 theory, should consistently receive around 10 percent of Marcos votes. And yet, nine of the 17 transmission periods show above average ratios for Pacquiao, ranging between 8.525 (11.73 percent) and 9.94 (10.06 percent).
In relation to his, a similar variation could be noted in the ratio between Marcos and fourth placer Francisco “Isko” Moreno Domagoso. On average, the ratio stood at 15.783, and following the 68-32 theory, Moreno should be having around 6 percent of Marcos votes. And yet, seven of 17 transmission periods gave Moreno above average ratios, ranging between 13.802 (7.25 percent) and 15.573 (6.42 percent).
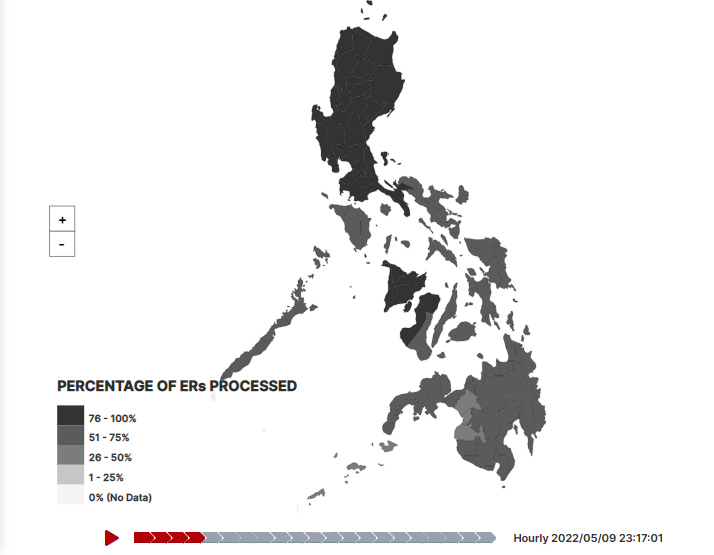
Perhaps part of the reason behind Pacquiao’s surge and Moreno’s decline as the transmission progressed would be the processing times of election returns in different areas of the Philippines. Notable here is the faster progression for most Luzon provinces while provinces in Visayas and Mindanao are quite behind. Why did the Marcos-Robredo pattern miss this? A probable answer might be the level of Robredo’s support in the national scale: the ratio appeared to be consistent because there is roughly one Robredo voter for every two Marcos voters nationwide.
This leads us to go beyond the cumulative count and look into the differences between transmission periods.
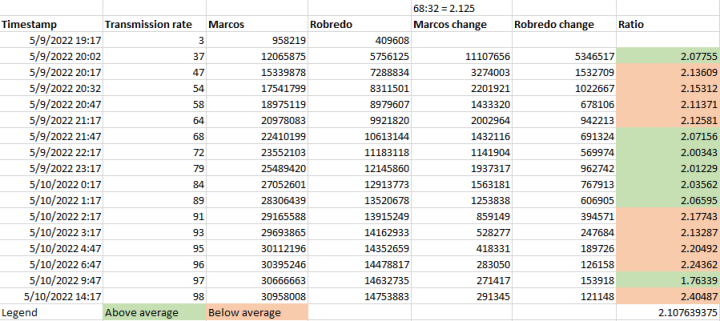
The variation then becomes less uniform, with the average moving down to 2.108 across 17 selected transmission periods. Compared to 16 periods when the ratio was better than average for Robredo, calibrating the analysis through this lens gives us just seven transmission periods where the ratios range between 1.763 (56.71 percent) and 2.078 (48.13 percent). Overall, the spread increases from 0.46 points in the cumulative analysis to 8.58 points in the individual analysis, a respectable enough gap in statistical terms. How about the vice presidential race?

Unlike the Marcos-Robredo ratio, the Duterte-Pangilinan ratio was gradually declining through time instead of hovering in the same range. The average ratio across 17 transmission periods stand at 3.343 (30 percent of Duterte votes), and nine of these are below average for Pangilinan. The range of the nine transmission periods are between 3.349 (29.86 percent) and 3.529 (28.34 percent). The same could be noted when Duterte’s numbers are compared with that of Vicente “Tito” Sotto and “Doc” Willie Ong, which supports the earlier observation that the later transmission of Visayas and Mindanao election returns may have reinforced the leads of Marcos and of Duterte.
Understanding the zones: How voting bailiwicks challenge a theory requiring consistency
Details may be lost in averaging, and that is probably how some people could come up with conspiracies involving election patterns and trends. Examining geographic and demographic lines, however, may provide insights on how regional choices end up building the electoral puzzle. Enter the law of large numbers.
The law assumes that the average (sample mean) of the results taken from a large number of trials are likely to be closer to the expected value (theoretical mean) than a smaller number, reflecting better the true preferences of the entire population. The trials are supposedly done independently, so while the variance in the micro level appears to be quite random, a pattern is likely to emerge at the macro level when zoomed out to spot the forest from the trees. Breaking down the election results in the local level would show difference on how the candidates performed.

Nationally, the 68-32 presidential ratio and the 77-23 vice presidential ratio between the first and second placers may seem to hold water, but through the regional lens, there are areas where the Marcos-Duterte tandem performed considerably better. Taking the regions on average, the ratio would be far from the national value: 4.667 for president (82-18), and 9.245 for vice president (90-10) across 17 regions of the Philippines. If the alleged “program” was supposedly uniform and consistent, how could the variations on how the regions voted be explained?
There were provinces, for instance, where neither Marcos nor Robredo triumphed. In Sarangani, Pacquiao had twice the votes Marcos had with 98 percent of the precincts reporting (160,476 – 78,230), while in Lanao del Sur, sixth placer Faisal Mangondato leads over Marcos (138,793 – 104,798) with 75 percent of the precincts reporting.
A similar situation could be noted in Sorsogon, where Sotto was leading (169,546) over Duterte (88,438) and Pangilinan (155,110) for the vice presidential race. A hundred percent of precincts have reported in the province.
Going back to the ratios, this means in any one region, Robredo is expected to receive 21.43 percent of Marcos votes, while Pangilinan 10.82 percent of Duterte votes. Again, this is an example where averages dilute the essence of the specifics. There are regions with more voters than others, and the vote share of each candidate in these regions vary. Yet when these numbers join together to form a national picture, a certain pattern or trend may be discerned. This is not a new phenomenon. Recall the controversy on the alleged “60-30-10” pattern back in the 2013 election.
For Marcos, the spread in the 17 regions range between 14.48 percent (Bicol Region) and 71.83 percent (Ilocos Region), while for Duterte, the spread range between 17.13 percent (Bicol Region) and 69.4 percent (Davao Region). Evidently, regional factors provided the leading candidates advantages and disadvantages, but the convergence of these proved to be sufficient to give them a majority of the votes, the first time since at least the 1981 elections.
Google Trends: Technical difficulty in mapping geographical factors
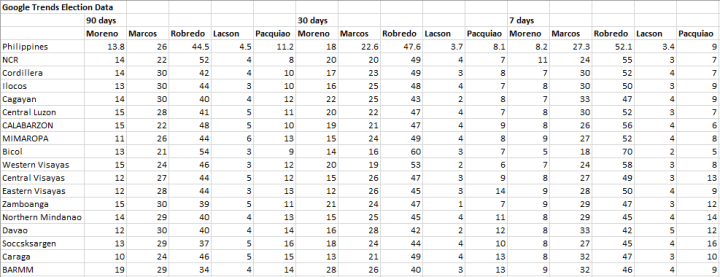
In relation to this analysis, Google Trends have also mapped regional interest for the top five presidential and vice presidential candidates. Like in the recently concluded election in South Korea (Republic of Korea), the Philippines adds to the list where Google Trends seems to be a far-off indicator than a reliable alternative to established pollsters like Pulse Asia and OCTA Research. After all, every major pre-election survey in the Philippines saw Marcos having a huge lead. Despite Robredo’s modest increase of support in the final count, it was not adequate to close the gap.
The Korean example saw more than half of the regions going contrary to what Google Trends was showing in terms of geographical strongholds for the two leading candidates, Lee Jae-myung and Yoon Suk-yeol. As it turned out, these divisions across regions run deep in Korean history, something that a 90-day or 7-day aggregated search history might not be able to fully reflect. The Filipino example was even more spectacular. Only in two regions was Robredo leading over Marcos in the partial and unofficial count, compared to all 17 regions of the Philippines in Google Trends. Nearly a complete flip of their 2016 performance. This demonstrates what Google Trends has been saying all along: A spike in a particular topic does not reflect that a topic is somehow “popular” or “winning.”
Besides, less than 70 percent of Filipinos have internet access as of 2022, compared to over 90 percent in South Korea. It may take some time before the power of online media permeates into every segment of Filipino society.
Conclusion
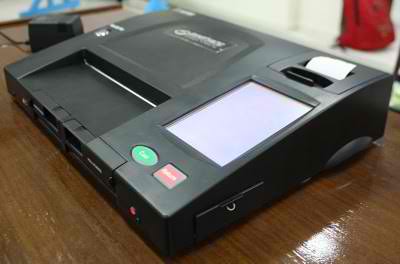
Unless it was a complex and convoluted plan to implement in the national scale, the idea of conspiracy under the watch of citizens’ arms such as the Parish Pastoral Council for Responsible Voting (PPCRV) and the poll watchers of the campaigns involved, as well as the pervasive eyes of digital media, might be farfetched. As COMELEC has earlier explained, each vote counting machine (VCM) is encrypted, certified, and had the source code reviewed. It will involve an immense, highly coordinated, and relatively speedy “hack” into their individual programs.
If the 2022 election demonstrated anything thus far, it has resolved both the transparency blackout dubbed as the “7-hour glitch” in 2019 and the slower pace of electoral returns’ transmission experienced in 2016. This is not to say, however, that the conduct of this year’s election was quite perfect in its entirety. While authorities would like to believe it was “generally peaceful,” nearly 2,000 VCM malfunctions were reported, around 2 percent of all VCMs in the country, and twice as many as the malfunctions reported in the 2016 election (801). If it were a close race and the counting went down to the last ballot, the effect of such malfunctions may be amplified in the public’s perspective.
Upgrading the machines, along with the prospects of internet voting as early as 2025, would be placed on the hands of the next administration. Nonetheless, solidifying public trust on the electoral process goes beyond technology. For instance, a study by Pew Research reveals that 49 percent believe that technology would “weaken” the core aspects of democracy in the next decade. Precincts where voters refuse to yield the integrity and the sanctity of their ballots, in addition to the periodic surfacing of theories on alleged rigging and vote manipulation, as well as the continuing war over information control, show that building trust and confidence in our political system needs continuing work.
Think of it for a while. What will the future of democracy look like?
Disclaimer: All figures used here for the 2022 election were derived from the partial and unofficial count available in the COMELEC Transparency Server. The official canvassing will take time before all the votes are counted.


Not every voting machine’s SDCard was tampered with, that’s why the variation, but the ratio, during every update, remained the same (rounded)
Now we are hearing that according to telcos there was no transmission one hour after closing precincts